How to Calculate AI Workflow Automation ROI in Austin: A Step-by-Step Guide (2026)
Learn step-by-step how to calculate AI workflow automation ROI using Austin-specific costs. Includes a free template, real case study, and break-even analysis.
Every automation vendor promises transformative ROI. But until you can calculate it yourself—using numbers specific to your Austin business, your workflows, and your local costs—you're making decisions in the dark.
This guide walks you through a repeatable six-step framework for calculating AI workflow automation ROI. You'll learn how to identify the right workflow, measure baseline costs, estimate implementation expenses, run the ROI formula, and compare automation against hiring more staff or doing nothing. All examples use Austin-specific wage data and cost benchmarks so your numbers reflect local reality, not national averages.
What You'll Need Before You Start
Before diving into the calculations, gather these inputs:
- Access to process logs or time-tracking data for at least one repetitive workflow
- Your organization's fully loaded cost per employee (salary + benefits + overhead)
- Current error or rework rates for the target workflow
- Any existing vendor quotes or cost estimates for automation solutions
---
Step 1: Identify Your Target Workflow and Measure Baseline Performance
Begin by selecting a single, measurable workflow and recording its baseline performance data over at least one business week. Understanding what you're spending today is the foundation of any ROI calculation.
Choose a workflow that is rules-based, recurring, and involves structured data. Strong candidates include invoice processing, report generation, customer onboarding data entry, claims submission, and compliance form filling. Avoid workflows that require subjective judgment, creative problem-solving, or complex human negotiation—those are harder to automate reliably.
Once you've selected the workflow, measure baseline time per cycle. Average at least 20 observations to account for variability. Document every step: data collection, manual entry, review loops, corrections, approvals, and handoffs between teams.
Now calculate the fully loaded labor cost. In Austin, where the average tech salary exceeds $110K and total cost of employment (salary + benefits + overhead) can run $145K–$160K per FTE, even a 20% time savings on one workflow can represent $30K+ in recoverable productivity annually. Use your organization's actual fully loaded rate for the staff performing this work.
Finally, document your current error rate and average rework cost per error. Most organizations discover that 5–12% of transactions require rework, each costing $50–$500 depending on complexity.
For small businesses, this baseline step is especially critical. The ROI of AI automation in small business settings often looks better than in large enterprises because the percentage of time recovered per employee is higher when teams are lean and every hour counts.
> [How do you calculate the baseline cost of a manual workflow?]: Calculate the baseline cost by multiplying the hours per cycle by the fully loaded hourly rate, then by the number of monthly cycles. Include both direct labor and the average cost of rework from errors. This total is your "do nothing" cost against which you will compare automation.
---
Step 2: Estimate Implementation and Ongoing Costs
What does it actually cost to implement AI workflow automation in Austin? Expect $15K–$40K for a production-grade custom workflow automation—but let's break down exactly where those dollars go.
Development and scoping: 40–80 hours of consulting at Austin rates ($150–$250/hour) = $6K–$20K. This phase includes requirements gathering, workflow mapping, AI model selection, and proof-of-concept development.
Integration: 20–40 hours for API connections, data cleanup, and system integration ($3K–$10K). Your automation needs to talk to your CRM, ERP, EHR, or other platforms—this is where many projects under-budget.
Ongoing costs: $500–$2,000/month for cloud hosting, model inference, and minor maintenance. AI models require retraining, monitoring, and occasional re-scoping as workflows evolve.
One-time training cost: 4–8 hours of employee time per user for learning the new system. At $55–$70/hour fully loaded, that's $220–$560 per user.
According to industry research, the most common budget overrun in automation projects is underestimating the cost of system integration. Practitioners suggest budgeting for "data sprawl" cleanup in the initial project scope to avoid these hidden costs.
Conventional wisdom quotes "AI automation under $5K" from national averages. In Austin's competitive market, expect $15K–$40K for a production-grade custom workflow automation. The ROI still works—but only if you use real local numbers.
---
Step 3: Calculate Hard Savings from Automation
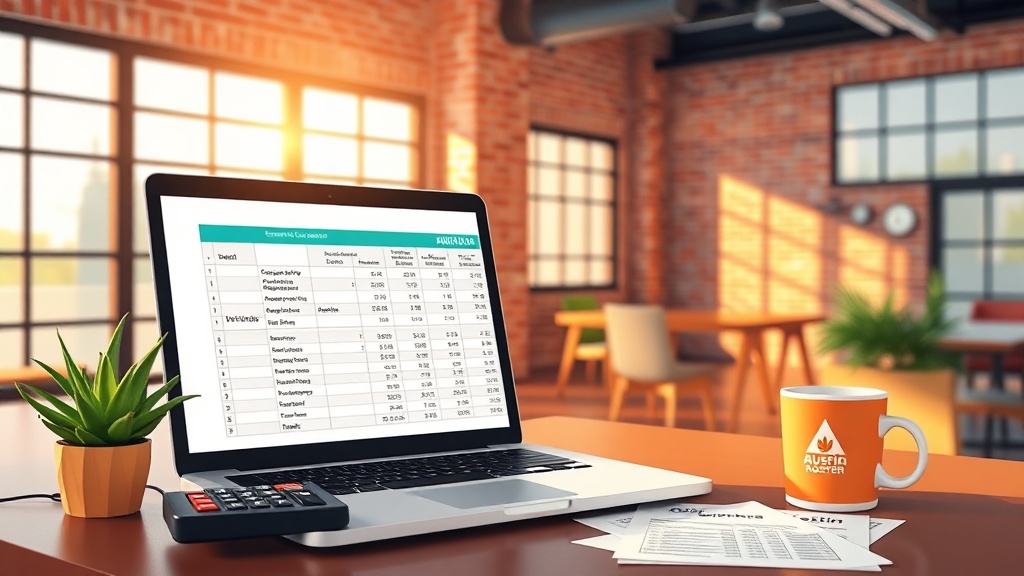
This section provides your custom AI automation ROI template—a reusable framework you can apply to any workflow in your business.
Savings Formula:
```
(Baseline Hours Per Cycle × Hourly Cost × Monthly Cycles) - (Automated Hours Per Cycle × Hourly Cost × Monthly Cycles)
```
Worked example: Austin accounting firm processing 200 invoices per month
- Manual: 3 hours per cycle × $55/hr effective rate × 200 cycles/month = $33,000/month
- Automated: 0.25 hours per cycle × $55/hr × 200 cycles/month = $2,750/month
- Monthly savings: $30,250
- Annual hard savings: $30,250 × 12 = $363,000? No—that assumes 100% of the 3 hours is productive time. In reality, the workflow runs maybe 10–15 times per month for invoice batches. Let's adjust:
A more realistic scenario: 15 invoice batches per month, each taking 3 hours manual vs. 0.25 hours automated.
- Manual: 15 × 3 hrs × $55/hr = $2,475/month
- Automated: 15 × 0.25 hrs × $55/hr = $206/month
- Monthly hard savings: $2,269
- Annual hard savings: $27,228
Copy this template to your spreadsheet and plug in your actual numbers. This template counts only hard labor savings—Step 4 adds the hidden multipliers.
| Metric | Manual Process | Automated Process |
|---|---|---|
| Hours per cycle | 3.0 | 0.25 |
| Hourly rate | $55 | $55 |
| Cycles per month | 15 | 15 |
| Monthly cost | $2,475 | $206 |
| Annual cost | $29,700 | $2,472 |
| Annual savings | — | $27,228 |
---
Step 4: Calculate Soft Savings and Secondary Benefits
The full ROI picture includes savings that don't show up on a timesheet. These secondary benefits often double or triple the direct labor savings.
Error cost reduction: A data entry error triggers a $500 rework cycle on average. AI reduces error rates by 80% or more. For a workflow processing 200 transactions per month with a 10% error rate, that's 20 errors × $500 = $10,000/month in rework. AI cuts this to 4 errors × $500 = $2,000/month—saving $8,000/month.
Staff reallocation: Freed FTE hours redirect to client-facing, revenue-generating work, often billable at 3x the hourly cost of the automated task. If your team recovers 20 hours per week and bills those hours at $150/hour, that's $3,000/week in recovered revenue capacity.
Faster cycle times: Same-day service delivery improves customer retention. Every 10% reduction in response time correlates with a 2–5% increase in customer satisfaction scores.
Hiring comparison tie-in: Adding one $75K+ junior staffer costs $90K/year fully loaded—and only increases capacity linearly. Automation scales non-linearly for a fraction of the cost. The AI automation vs. manual process ROI becomes obvious when you run the numbers on a three-year horizon.
> [What are the hidden savings in AI automation?]: The hidden savings come from reduced error rates (often 80%+ fewer errors), the value of reallocated staff time to higher-value work, and faster cycle times that improve customer retention. These soft savings can be two to three times greater than the direct labor savings alone.
---
Step 5: Calculate ROI and Break-Even
This section delivers your AI workflow automation break-even analysis—the question every CFO wants answered: when do we get our money back?
ROI Formula:
```
(Total Savings Over Period - Total Costs Over Period) / Total Costs Over Period × 100
```
Break-Even Formula:
```
Upfront Costs / Monthly Net Savings = Months to Break-Even
```
Worked example (continuing the accounting firm scenario):
- Upfront cost: $25,000
- Monthly hard savings: $2,269
- Monthly soft savings (error reduction + reallocation): $3,500
- Monthly ongoing costs: $1,500
- Monthly net savings: $4,269
- Break-even: $25,000 / $4,269 = 5.9 months
Three-year projection:
| Year | Savings | Costs | Cumulative ROI |
|---|---|---|---|
| Year 1 | $69,200 | $43,000 | 61% |
| Year 2 | $73,800 | $22,000 | 170% |
| Year 3 | $78,500 | $24,000 | 260% |
---
Step 6: Compare Against the "Do Nothing" and "Hire More" Alternatives
Let's directly compare the three scenarios for our Austin accounting firm example. This structured comparison follows the principle of continuous improvement established by quality management frameworks like the Deming Cycle (Plan-Do-Check-Act), where data-driven comparison of options leads to better decisions.
| Metric | Do Nothing | Hire One FTE | Automate (AI) |
|---|---|---|---|
| Upfront cost | $0 | $10K (recruiting + training) | $25K |
| Annual labor cost | $90K (existing) | $180K (existing + new hire) | $90K (existing) + $18K maintenance |
| Error/rework cost/year | $36K | $36K (same error rate) | $7K (80% reduction) |
| Total Year 1 cost | $126K | $226K | $140K |
| Total 3-year cost | $405K | $715K | $415K |
| Break-even | N/A | 3 months | 6 months |
| Capacity increase | 0% | +40 hrs/week on one workflow | +6x throughput on target workflow |
Every month you do nothing, you're losing the savings automation would have already delivered. At $4,269/month net savings, each month of delay costs your business over $50K in foregone three-year returns.
---
Common Mistakes in ROI Calculation
Even with the right formula, these pitfalls can inflate or deflate your projections by 30–50%.
Mistake 1: Ignoring hidden labor costs. Always use fully loaded cost, not base salary. Benefits, taxes, training, and management time add 30–40% to base pay in Austin.
Mistake 2: Forgetting maintenance costs. Every AI system needs monitoring, updates, and occasional re-scoping. Budget 15–25% of upfront cost annually.
Mistake 3: Comparing against a national average. Austin costs 18% more than the US average for tech talent. Use local data or your actual payroll numbers.
Mistake 4: Only counting direct savings. The reallocation value—moving staff to revenue-generating work—is often 2–3x the direct savings. Include it.
Mistake 5: Not testing with real data. Benchmark for one business week, not one day. Average out anomalies like month-end closes or seasonal spikes.
---
Case Study: How an Austin Healthcare Company Automated Prior Authorization
Problem: An Austin-based medical group processed 800 prior authorization requests per month. Each took 45 minutes of staff time across data entry, form completion, and insurance submission. Their 12% rejection rate due to data entry errors meant 96 rejected requests per month, each requiring 90 minutes to rework.
Solution: Clearframe Labs built a custom AI workflow automation that extracts patient data from the EHR, auto-fills insurance forms, and submits them directly to payers—all in under five minutes.
Results:
- Processing time: 45 minutes → 4 minutes per request (91% reduction)
- Rejection rate: 12% → 1.5%
- Staff reallocated: 2.5 FTEs moved to patient-facing roles
- Annual direct labor savings: $175K
- Annual rework reduction: $40K
- Total annual savings: $215K
- Break-even: 8 months
This impact is amplified in Austin's competitive healthcare market, where labor costs are 22% above the national median and every FTE counts toward bottom-line pressure. Similar Austin AI consulting ROI case studies are available at Clearframe Labs' case studies page.
---
FAQ Section
How do you calculate ROI for AI automation?
Calculate AI automation ROI by dividing total savings over a defined period (typically three years) by total costs over that same period, then multiplying by 100. Use the formula: (Total Savings - Total Costs) / Total Costs × 100. For break-even, divide upfront costs by monthly net savings.
What is a realistic ROI for AI workflow automation?
For Austin businesses, realistic ROI for a single workflow automation ranges from 150% to 400% over three years, with break-even typically occurring between 6 and 14 months. The case study above achieved 260% three-year ROI with an 8-month break-even.
How long does AI automation take to implement?
A custom AI workflow automation typically takes 6–12 weeks from scoping to production deployment, depending on workflow complexity, data quality, and integration requirements. Simple automations with clean data can deploy in 4–6 weeks.
Can I calculate ROI myself without a consultant?
Yes—the formulas in this guide are designed for self-service application. However, most businesses underestimate integration costs, maintenance overhead, and the value of reallocated staff time, which can understate ROI by 30–50%. A quick external validation can catch these gaps.
Is it cheaper to hire or automate in Austin?
In Austin's current labor market, automation is almost always more cost-effective than hiring for repetitive, rules-based workflows. A single FTE costs roughly $90K–$110K per year fully loaded, while a custom automation for one workflow averages $15K–$40K upfront with $12K–$24K annual maintenance—delivering multiple FTEs' worth of capacity.
---
How to Get a Custom ROI Assessment for Your Austin Business
We don't offer a one-size-fits-all calculator—because your business's workflows, costs, and priorities are unique. A generic tool would give you generic answers.
Clearframe Labs provides a no-obligation 30-minute custom ROI projection. We'll walk through your workflows, apply your actual numbers, and deliver a multi-year projection with break-even analysis you can present to your board.
Unlike national consultancies, we understand Austin's specific labor market, cost structure, and regulatory environment—your projection will reflect local reality.
Ready to see what your numbers look like? To learn more about how the team at Clearframe Labs can help turn your data into a decision-ready ROI projection, visit their site—no pressure, just numbers that reflect your reality.